Edit chart
Loading graph
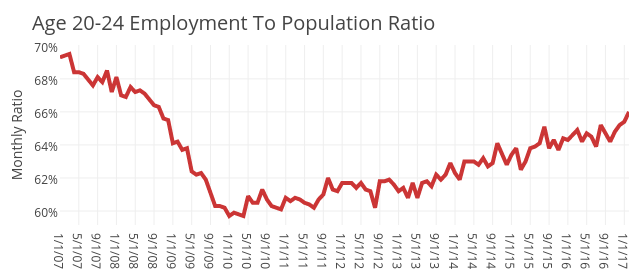
Governing's interactive graph and data of "Age 20-24" is a line chart, showing Age 20-24; with Monthly Ratio in the y-axis. The x-axis shows values from 0 to 121. The y-axis shows values from 59.15555555555556 to 70.04444444444445. This visualization has the following annotation: Age 20-24 Employment To Population Ratio