Edit chart
Loading graph
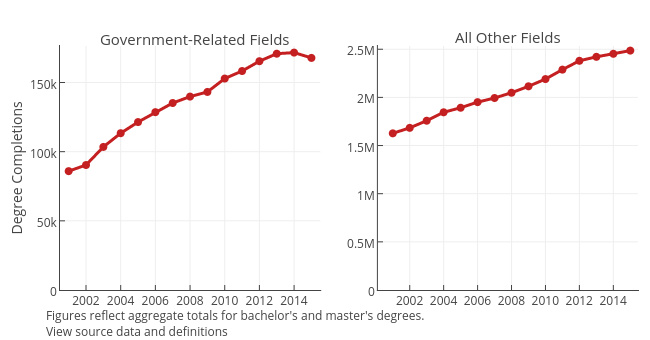
Governing's interactive graph and data of "B vs C" is a line chart, showing B vs C; with Degree Completions in the y-axis. The x-axis shows values from 2000.5 to 2015.5. The y-axis shows values from 0 to 176382.44444444444. This visualization has the following annotations: Government-Related Fields; All Other Fields; Figures reflect aggregate totals for bachelor's and master's degrees. View source data and definitions