Edit chart
Loading graph
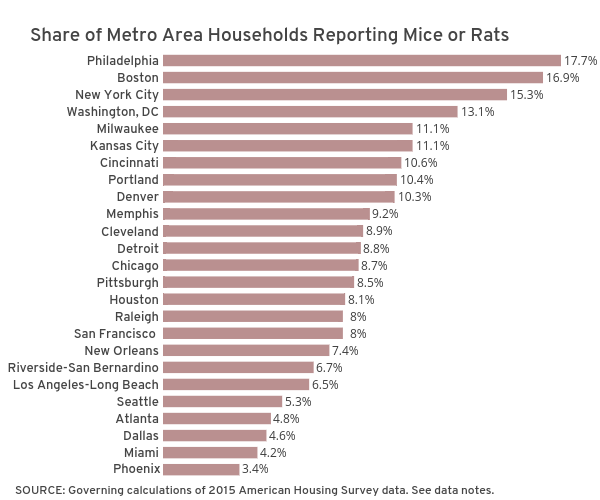
Governing's interactive graph and data of "A" is a bar chart, showing A. The x-axis shows values from 0 to 19.434422110552763. The y-axis shows values from -1.7788206372875184 to 24.615876260959087. This visualization has the following annotations: 3.4%; 4.2%; 4.6%; 4.8%; 5.3%; 6.5%; 6.7%; 7.4%; 8%; 8%; 8.1%; 8.5%; 8.7%; 8.8%; 8.9%; 9.2%; 17.7%; 16.9%; 15.3%; 13.1%; 11.1%; 11.1%; 10.6%; 10.4%; 10.3%; SOURCE: Governing calculations of 2015 American Housing Survey data. See data notes.; Share of Metro Area Households Reporting Mice or Rats; Phoenix