Edit chart
Loading graph
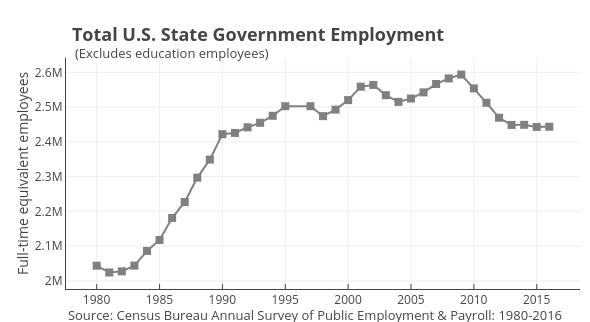
Governing's interactive graph and data of "B" is a line chart, showing B; with Full-time equivalent employees in the y-axis. The x-axis shows values from 1977.5581087052585 to 2018.4418912947415. The y-axis shows values from 1976545.4029813036 to 2641219.5970186964. This visualization has the following annotations: Total U.S. State Government Employment; Source: Census Bureau Annual Survey of Public Employment & Payroll: 1980-2016; (Excludes education employees)