Edit chart
Loading graph
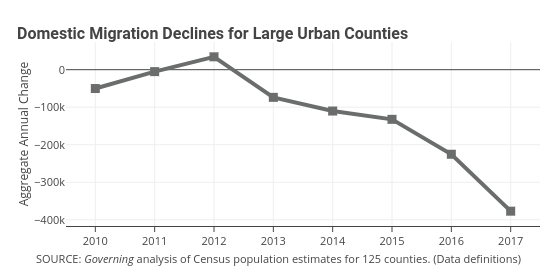
Governing's interactive graph and data of "B" is a line chart, showing B; with Aggregate Annual Change in the y-axis. The x-axis shows values from 2009.5057782592994 to 2017.4942217407006. The y-axis shows values from -416570.55296404276 to 73788.55296404276. This visualization has the following annotations: Domestic Migration Declines for Large Urban Counties; SOURCE: Governing analysis of Census population estimates for 125 counties. (Data definitions)