Edit chart
Loading graph
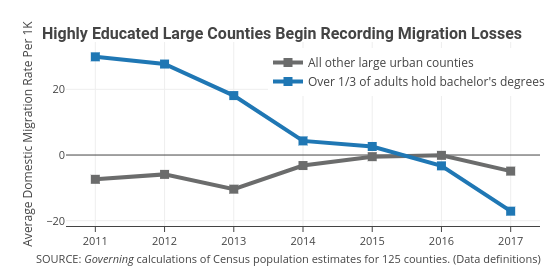
Governing's interactive graph and data of "All other large urban counties vs Over 1/3 of adults hold bachelor's degrees" is a line chart, showing All other large urban counties vs Over 1/3 of adults hold bachelor's degrees; with Average Domestic Migration Rate Per 1K in the y-axis. The x-axis shows values from 2010.5763813651138 to 2017.4236186348862. The y-axis shows values from -21.61425332037577 to 34.414253320375764. This visualization has the following annotations: Highly Educated Large Counties Begin Recording Migration Losses; SOURCE: Governing calculations of Census population estimates for 125 counties. (Data definitions)