Edit chart
Loading graph
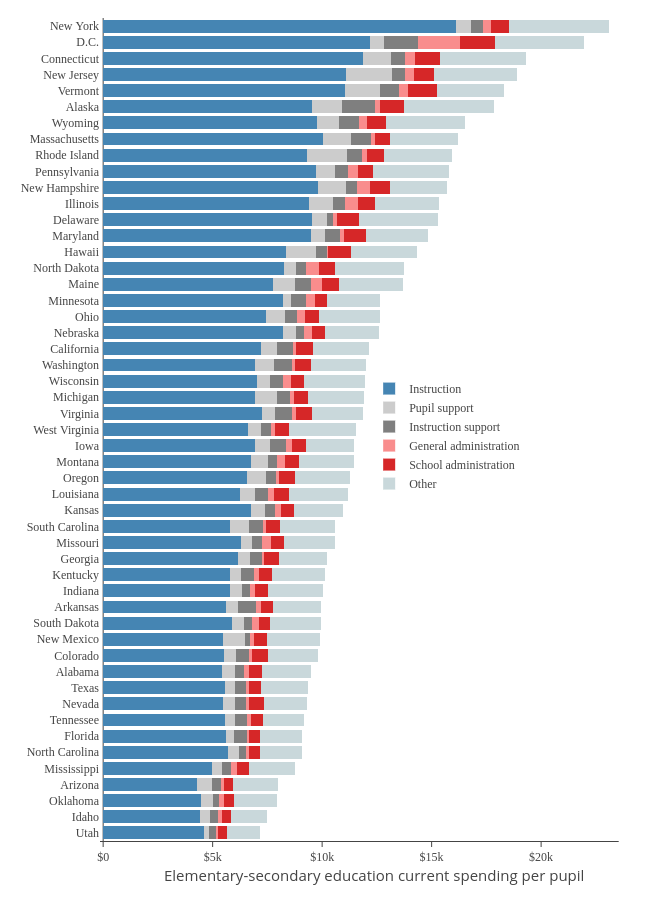
Governing's interactive graph and data of "Instruction, Pupil support, Instruction support, General administration, School administration, Other" is a stacked bar chart, showing Instruction, Pupil support, Instruction support, General administration, School administration, Other. The x-axis shows values from -144 to 23543.157894736843. The y-axis shows values from -0.5 to 50.5. This visualization has the following annotation: Elementary-secondary education current spending per pupil