Edit chart
Loading graph
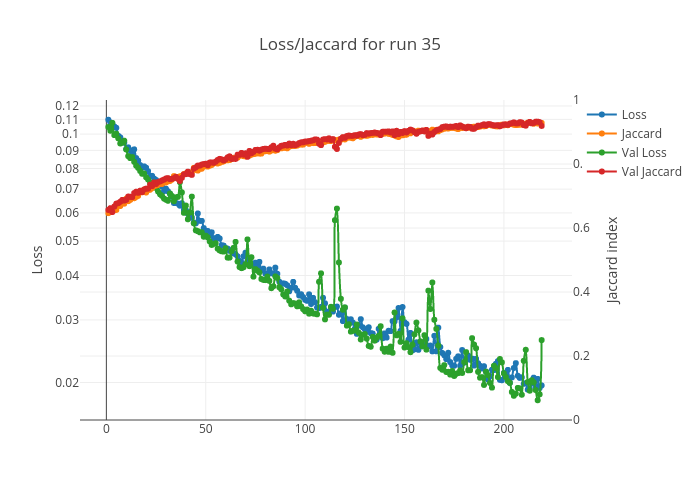
Grant2d2's interactive graph and data of "Loss/Jaccard for run 35" is a line chart, showing Loss, Jaccard, Val Loss, Val Jaccard; with Loss in the y-axis. The x-axis shows values from 0 to 0. The y-axis shows values from 0 to 0.