Nov 3
2013
Nov 17
Dec 1
Dec 15
Dec 29
Jan 12
2014
Jan 26
Feb 9
Feb 23
Mar 9
0
200
400
600
800
1000
1200
1400
1.02
1.03
1.04
1.05
1.06
1.07
bsp_532_Mm^-1
fRH
bsp_fRH_550
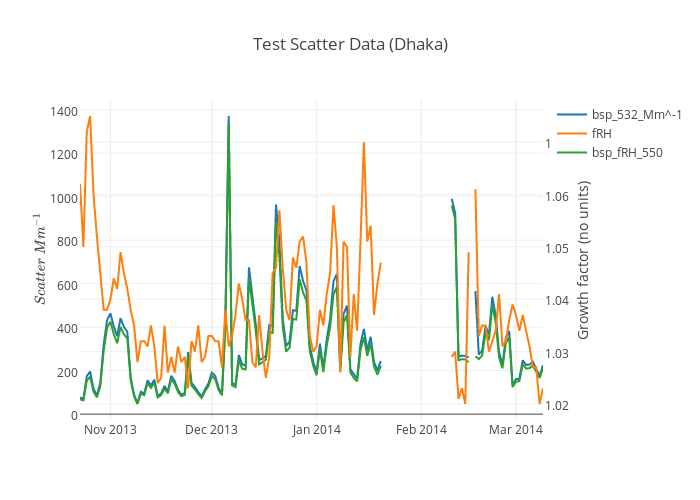
Test Scatter Data (Dhaka)
Nephelometer scatter $Scatter Mm^{-1}$
Growth factor (no units)
plotly-logomark
Edit chart
Loading graph
Graydon2's interactive graph and data of "Test Scatter Data (Dhaka)" is a scatter chart, showing bsp_532_Mm^-1, fRH, bsp_fRH_550; with time in the x-axis and Nephelometer scatter $Scatter Mm^{-1}$ in the y-axis.. The x-axis shows values from 1382497200000 to 1394337600000. The y-axis shows values from -26.946111111111115 to 1444.576111111111.