Li
Mg
P
Ca
V
Mn
Co
Cu
As
Ag
Sb
Ce
1
10
100
1000
Li
Mg
P
Ca
V
Mn
Co
Cu
As
Ag
Sb
Ce
1
10
100
Li
Mg
P
Ca
V
Mn
Co
Cu
As
Ag
Sb
Ce
1
10
100
Li
Mg
P
Ca
V
Mn
Co
Cu
As
Ag
Sb
Ce
1
10
100
1000
Li
Mg
P
Ca
V
Mn
Co
Cu
As
Ag
Sb
Ce
2
5
1
2
5
10
2
5
100
2
Li
Mg
P
Ca
V
Mn
Co
Cu
As
Ag
Sb
Ce
2
5
1
2
5
10
2
5
100
2
Li
Mg
P
Ca
V
Mn
Co
Cu
As
Ag
Sb
Ce
10
100
1000
10k
Li
Mg
P
Ca
V
Mn
Co
Cu
As
Ag
Sb
Ce
1
10
100
$\text{Conc., }\mu \text{g m}^3$
$\text{Conc., }\mu \text{g m}^3$
$\text{Conc., }\mu \text{g m}^3$
$\text{Conc., }\mu \text{g m}^3$
$\text{Conc., }\mu \text{g m}^3$
$\text{Conc., }\mu \text{g m}^3$
$\text{Conc., }\mu \text{g m}^3$
$\text{Conc., }\mu \text{g m}^3$
INKA
IDBD
PHMO
BDDU
USEM
USMC
CHTS
NGIL
plotly-logomark
Edit chart
Loading graph
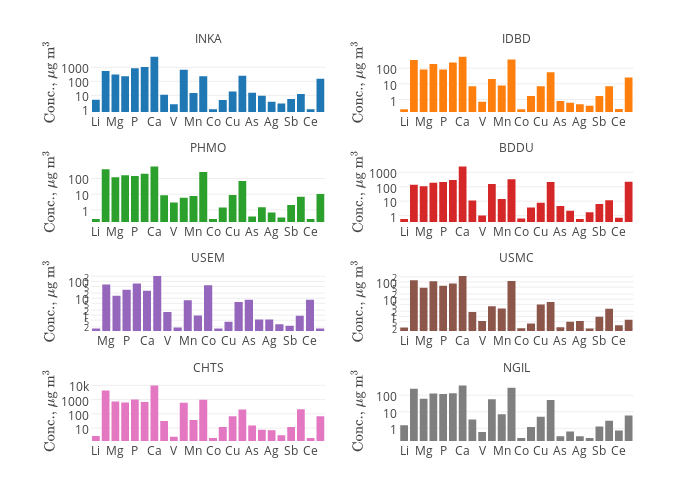
Graydon2's interactive graph and data is a grouped bar chart. The x-axis shows values from 0 to 0. The y-axis shows values from 0 to 0. This visualization has the following annotations: INKA; IDBD; PHMO; BDDU; USEM; USMC; CHTS; NGIL