Edit chart
Loading graph
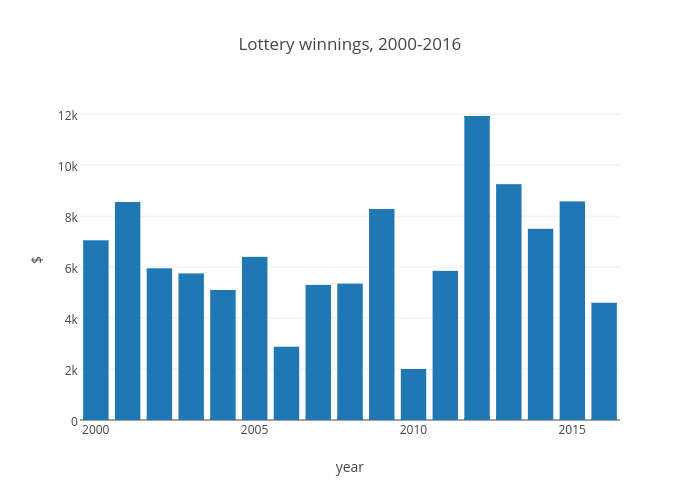
Greencracker's interactive graph and data of "Lottery winnings, 2000-2016" is a bar chart, showing B; with year in the x-axis and $ in the y-axis.. The x-axis shows values from 1999.5 to 2016.5. The y-axis shows values from 0 to 12552.631578947368.