Edit chart
Loading graph
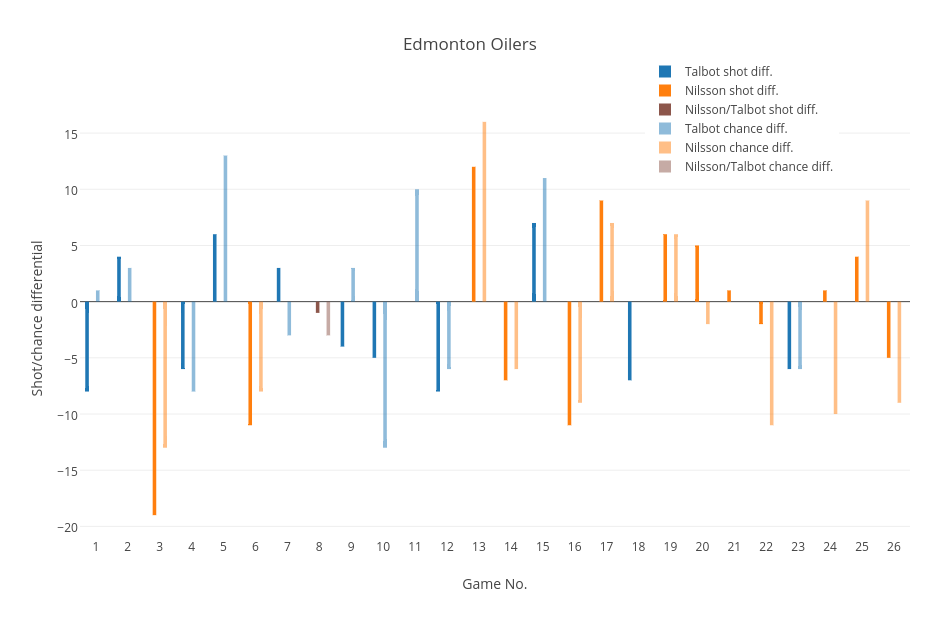
Grspur's interactive graph and data of "Edmonton Oilers" is a grouped bar chart, showing Talbot shot diff., Nilsson shot diff., Nilsson/Talbot shot diff., Talbot chance diff., Nilsson chance diff., Nilsson/Talbot chance diff.; with Game No. in the x-axis and Shot/chance differential in the y-axis.. The x-axis shows values from 0.5 to 26.5. The y-axis shows values from -20.944444444444446 to 17.944444444444446.