Edit chart
Loading graph
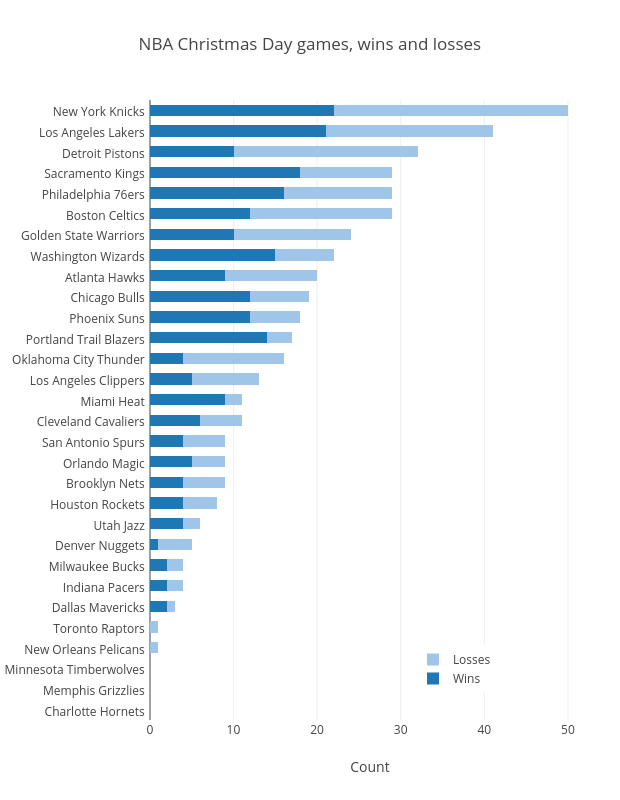
Grspur's interactive graph and data of "NBA Christmas Day games, wins and losses" is a stacked bar chart, showing Wins vs Losses; with Count in the x-axis. The x-axis shows values from 0 to 52.631578947368425. The y-axis shows values from -0.5 to 29.5.