Edit chart
Loading graph
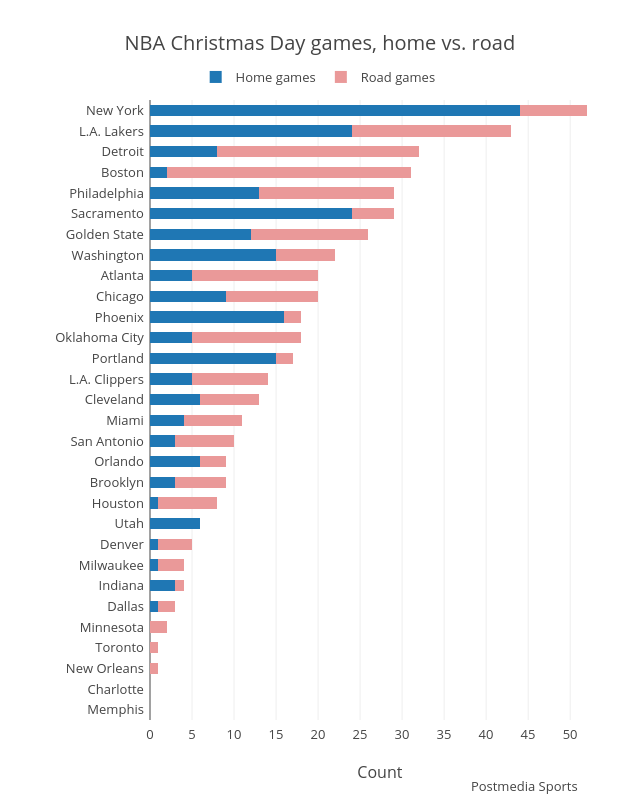
Grspur's interactive graph and data of "NBA Christmas Day games, home vs. road" is a stacked bar chart, showing Home games vs Road games; with Count in the x-axis. The x-axis shows values from 0 to 54.73684210526316. The y-axis shows values from -0.5 to 29.5. This visualization has the following annotation: Postmedia Sports