Edit chart
Loading graph
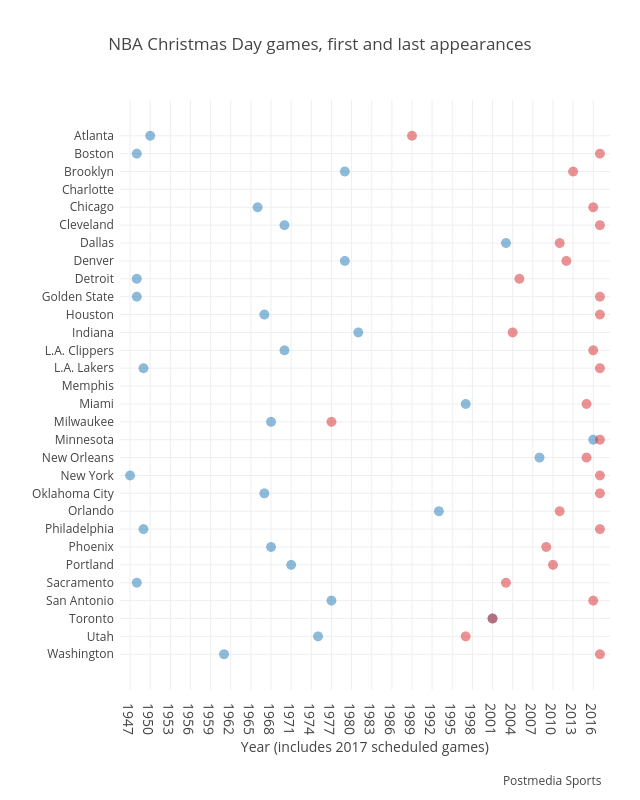
Grspur's interactive graph and data of "NBA Christmas Day games, first and last appearances" is a scatter chart, showing Team vs Team; with Year (includes 2017 scheduled games) in the x-axis. The x-axis shows values from 1945.5 to 2018.5. The y-axis shows values from -1.9995178399228546 to 30.999517839922856. This visualization has the following annotation: Postmedia Sports