Edit chart
Loading graph
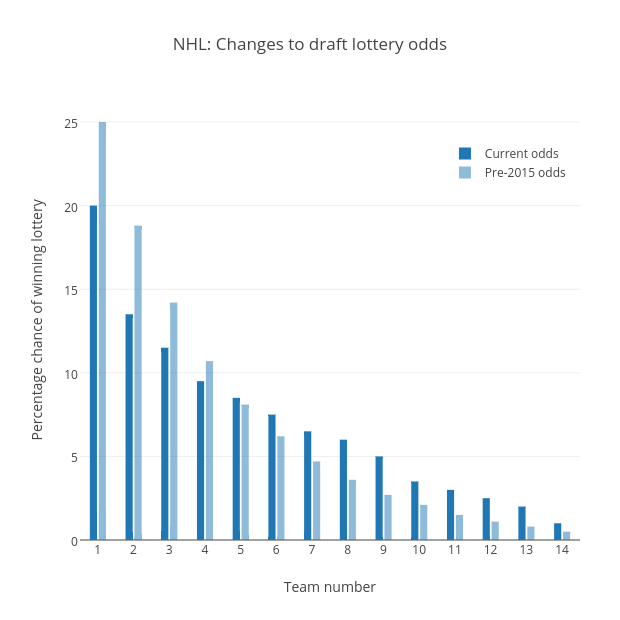
Grspur's interactive graph and data of "NHL: Changes to draft lottery odds " is a bar chart, showing Current odds vs Pre-2015 odds; with Team number in the x-axis and Percentage chance of winning lottery in the y-axis.. The x-axis shows values from 0.5 to 14.5. The y-axis shows values from 0 to 26.315789473684212.