Edit chart
Loading graph
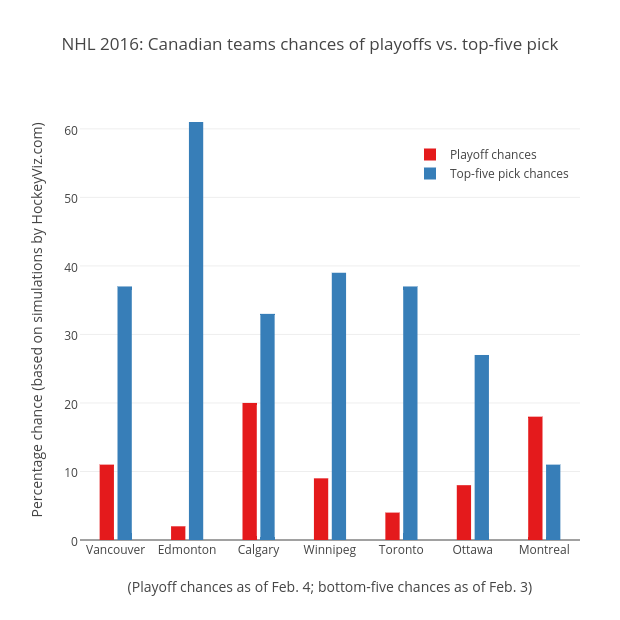
Grspur's interactive graph and data of "NHL 2016: Canadian teams chances of playoffs vs. top-five pick" is a bar chart, showing Playoff chances vs Top-five pick chances; with (Playoff chances as of Feb. 4; bottom-five chances as of Feb. 3) in the x-axis and Percentage chance (based on simulations by HockeyViz.com) in the y-axis.. The x-axis shows values from -0.5 to 6.5. The y-axis shows values from 0 to 64.21052631578948.