Edit chart
Loading graph
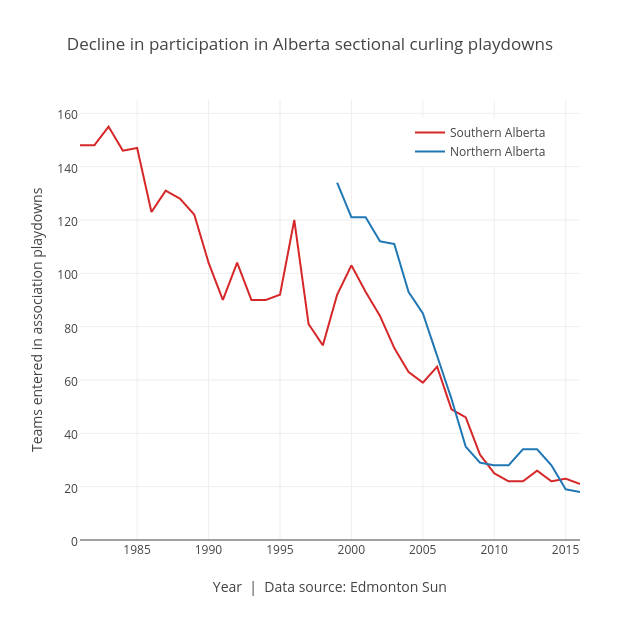
Grspur's interactive graph and data of "Decline in participation in Alberta sectional curling playdowns" is a scatter chart, showing Southern Alberta vs Northern Alberta; with Year | Data source: Edmonton Sun in the x-axis and Teams entered in association playdowns in the y-axis.. The x-axis shows values from 1981 to 2016. The y-axis shows values from 0 to 165.