Edit chart
Loading graph
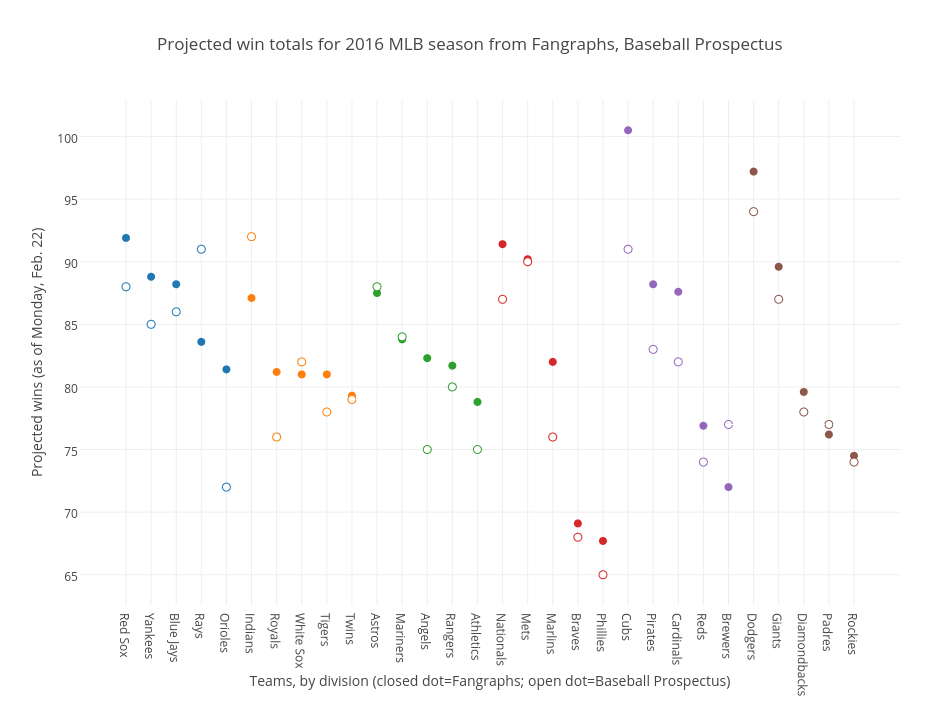
Grspur's interactive graph and data of "Projected win totals for 2016 MLB season from Fangraphs, Baseball Prospectus" is a scatter chart, showing 1, 2, 3, 4, 5, 6, 1, 2, 3, 4, 5, 6; with Teams, by division (closed dot=Fangraphs; open dot=Baseball Prospectus) in the x-axis and Projected wins (as of Monday, Feb. 22) in the y-axis.. The x-axis shows values from -1.8324175824175823 to 30.832417582417584. The y-axis shows values from 62.58408323959505 to 102.91591676040495.