Edit chart
Loading graph
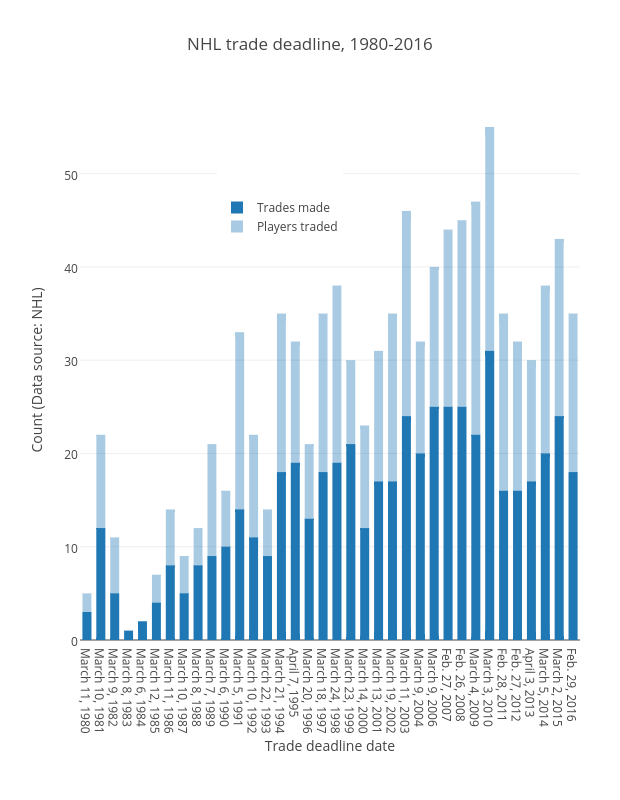
Grspur's interactive graph and data of "NHL trade deadline, 1980-2016" is a overlaid bar chart, showing , , , , Trades made, Players traded; with Trade deadline date in the x-axis and Count (Data source: NHL) in the y-axis.. The x-axis shows values from -0.5 to 35.5. The y-axis shows values from 0 to 57.89473684210526.