Edit chart
Loading graph
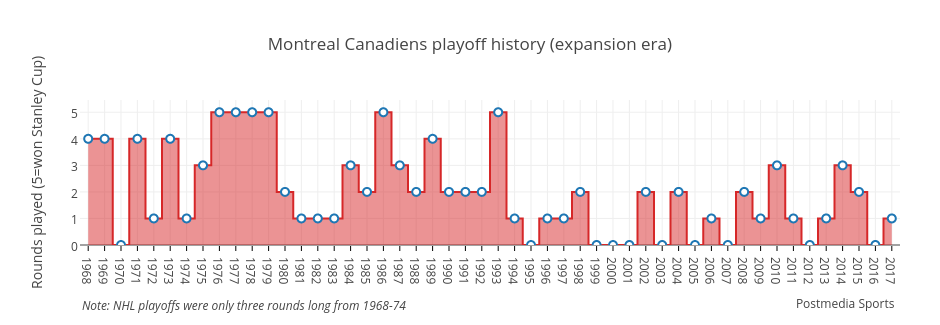
Grspur's interactive graph and data of "Montreal Canadiens playoff history (expansion era)" is a filled line chart, showing Advancement; with Rounds played (5=won Stanley Cup) in the y-axis. The x-axis shows values from 1967.5 to 2017.5. The y-axis shows values from 0 to 5.4613935969868175. This visualization has the following annotations: Note: NHL playoffs were only three rounds long from 1968-74; Postmedia Sports