Edit chart
Loading graph
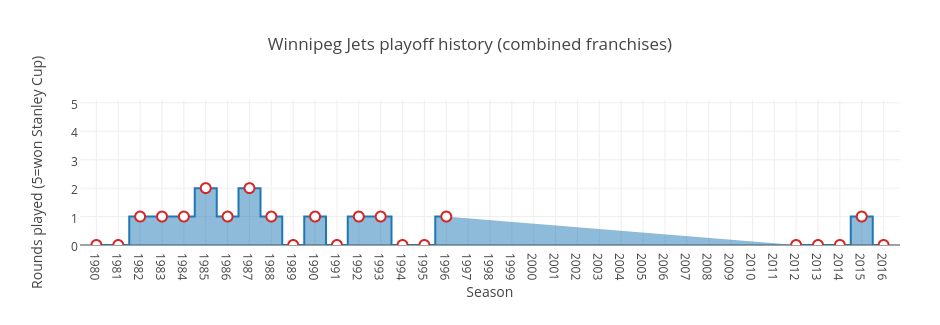
Grspur's interactive graph and data of "Winnipeg Jets playoff history (combined franchises)" is a filled line chart, showing Rounds played (5=won Stanley Cup); with Season in the x-axis and Rounds played (5=won Stanley Cup) in the y-axis.. The x-axis shows values from 1979.25 to 2016.75. The y-axis shows values from 0 to 5.1.