Edit chart
Loading graph
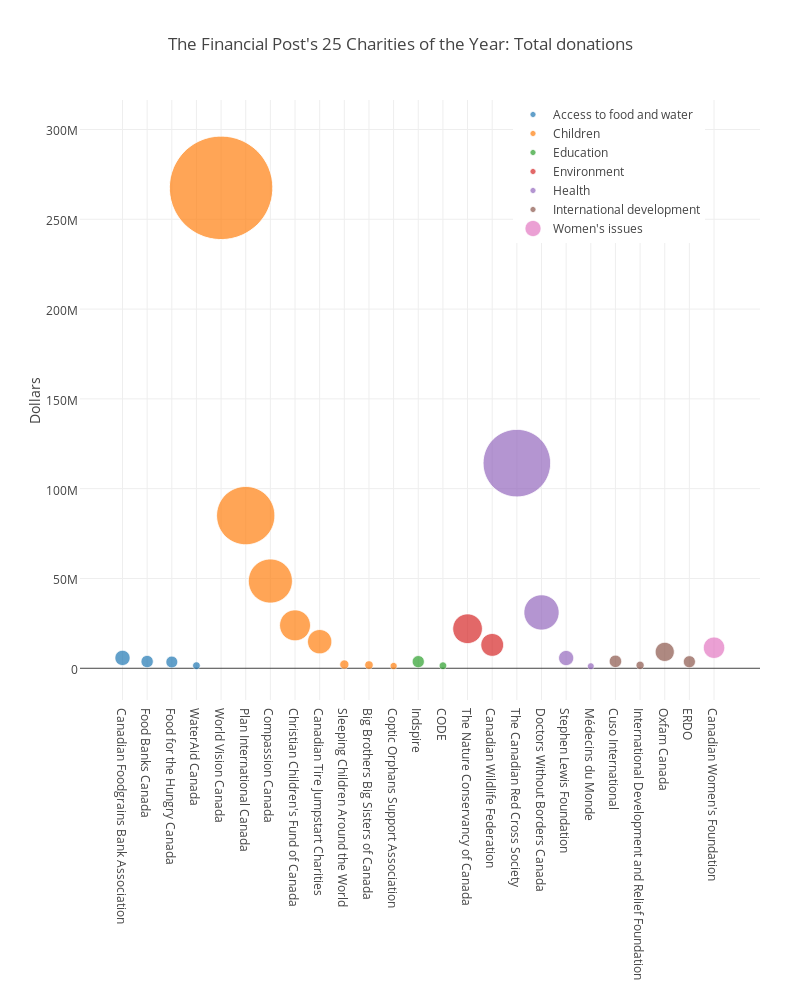
Grspur's interactive graph and data of "The Financial Post's 25 Charities of the Year: Total donations" is a scatter chart, showing Access to food and water, Children, Education, Environment, Health, International development, Women's issues; with Dollars in the y-axis. The x-axis shows values from -1.7241345378532589 to 25.864645832743825. The y-axis shows values from -17664324.41582457 to 316406957.81017375.