Edit chart
Loading graph
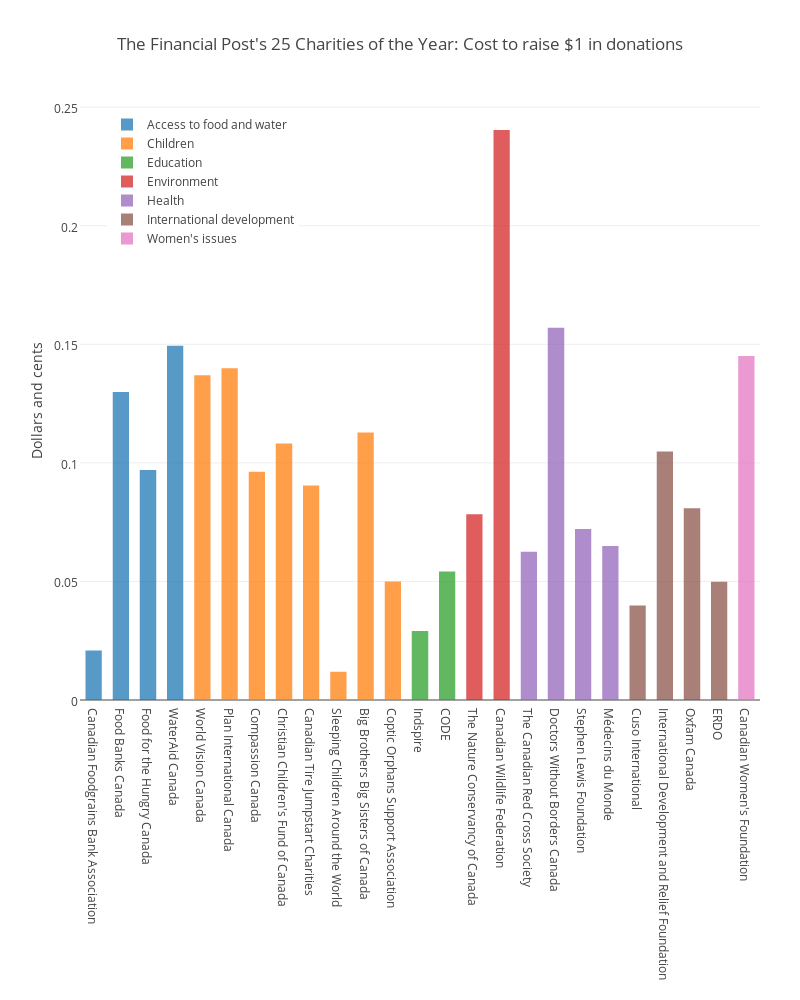
Grspur's interactive graph and data of "The Financial Post's 25 Charities of the Year: Cost to raise $1 in donations" is a grouped bar chart, showing Access to food and water, Children, Education, Environment, Health, International development, Women's issues; with Dollars and cents in the y-axis. The x-axis shows values from -0.5 to 24.5. The y-axis shows values from 0 to 0.2530473452631579.