Edit chart
Loading graph
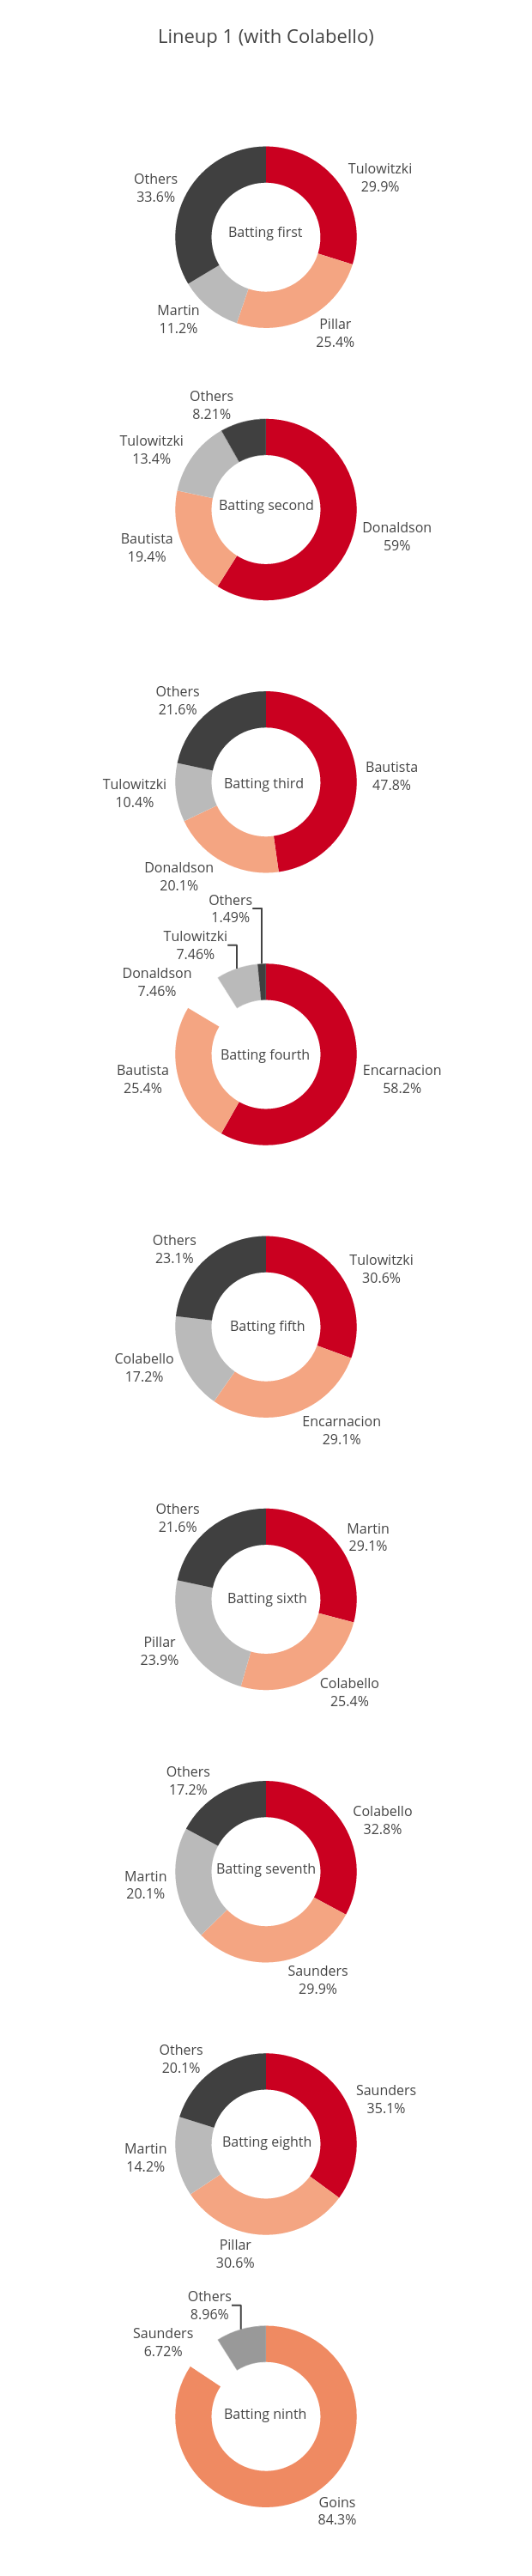
Grspur's interactive graph and data of "Lineup 1 (with Colabello)" is a pie, showing Col2, Col4, Col6, Col8, Col10, Col12, Col14, Col16, Col18. The x-axis shows values from 0 to 0. The y-axis shows values from 0 to 0. This visualization has the following annotations: Batting first; Batting second; Batting third; Batting fourth; Batting fifth; Batting sixth; Batting seventh; Batting eighth; Batting ninth