Edit chart
Loading graph
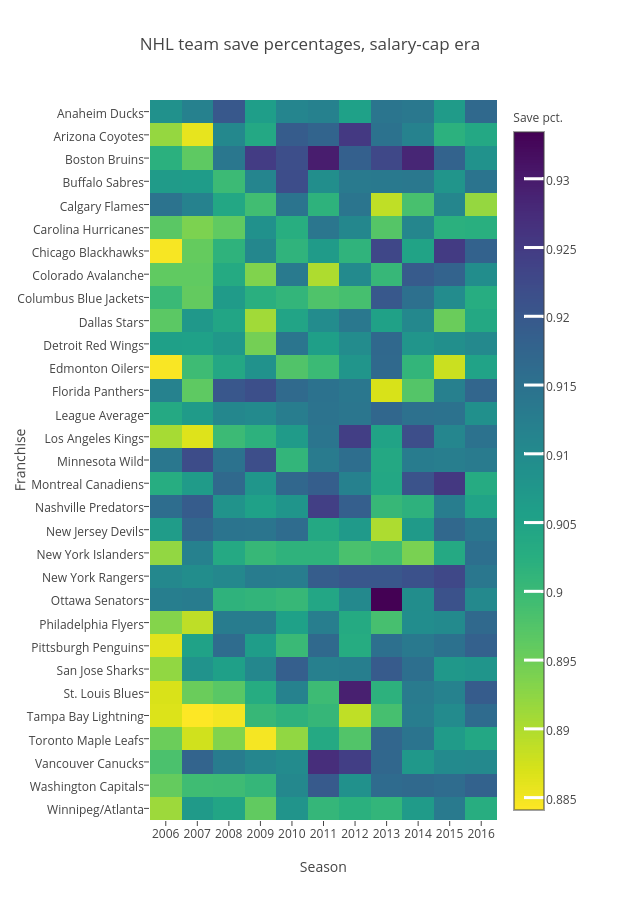
Grspur's interactive graph and data of "NHL team save percentages, salary-cap era" is a heatmap, showing Save Pct.; with Season in the x-axis and Franchise in the y-axis.. The x-axis shows values from 2005.5 to 2016.5. The y-axis shows values from -0.5 to 30.5.