Edit chart
Loading graph
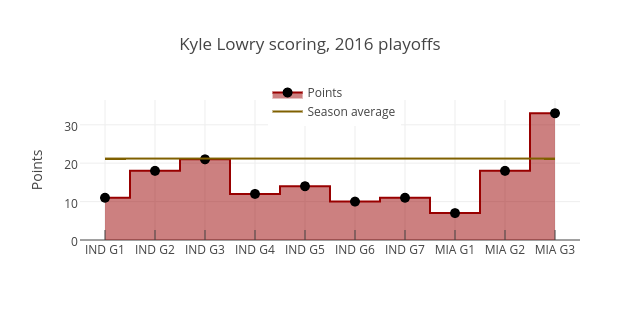
Grspur's interactive graph and data of "Kyle Lowry scoring, 2016 playoffs" is a filled line chart, showing Points vs Season average; with Points in the y-axis. The x-axis shows values from -0.5 to 9.5. The y-axis shows values from 0 to 36.44970414201183.