Edit chart
Loading graph
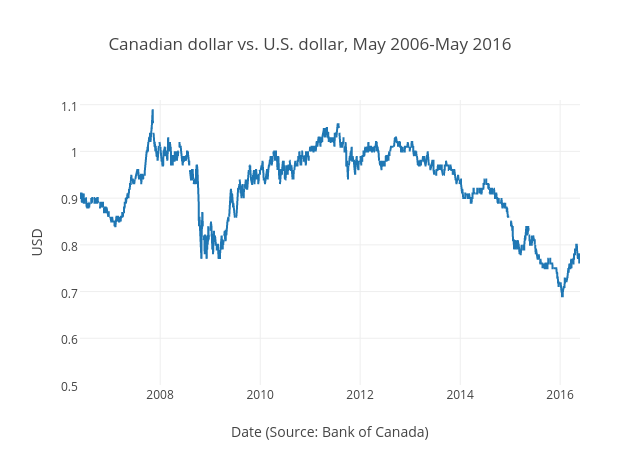
Grspur's interactive graph and data of "Canadian dollar vs. U.S. dollar, May 2006-May 2016" is a scatter chart, showing USD; with Date (Source: Bank of Canada) in the x-axis and USD in the y-axis.. The x-axis shows values from 1148529600000 to 1464148800000. The y-axis shows values from 0.5 to 1.11.