Edit chart
Loading graph
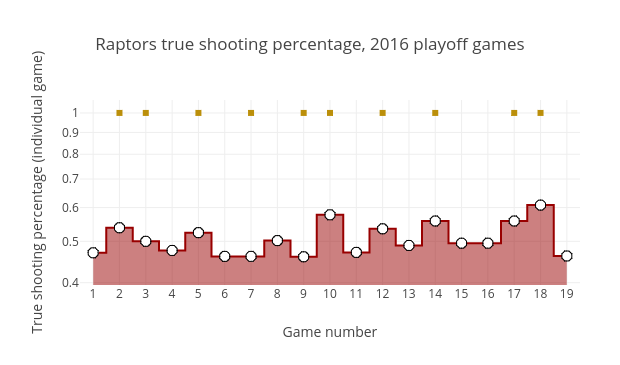
Grspur's interactive graph and data of "Raptors true shooting percentage, 2016 playoff games" is a filled scatter chart, showing TS Pct. vs Win/Loss; with Game number in the x-axis and True shooting percentage (individual game) in the y-axis.. The x-axis shows values from 0.5000000000000001 to 19.499999999999993. The y-axis shows values from -0.4034029043735397 to 0.03031191426883888.