Edit chart
Loading graph
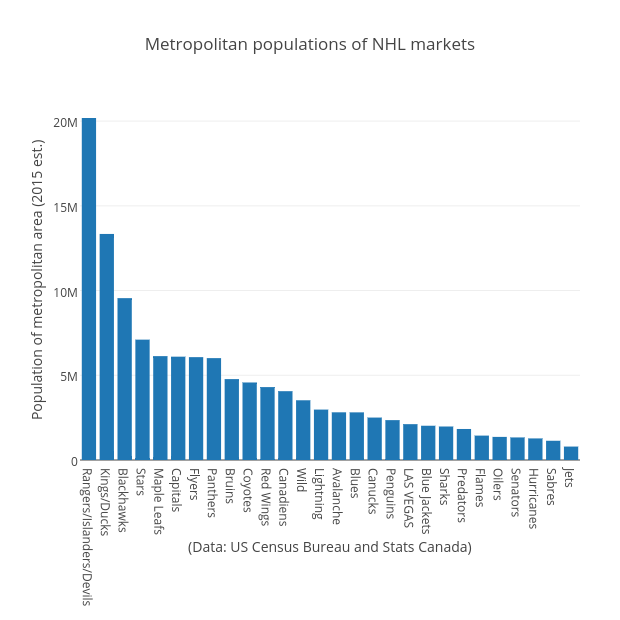
Grspur's interactive graph and data of "Metropolitan populations of NHL markets" is a bar chart, showing B; with (Data: US Census Bureau and Stats Canada) in the x-axis and Population of metropolitan area (2015 est.) in the y-axis.. The x-axis shows values from -0.5 to 27.5. The y-axis shows values from 0 to 21244531.57894737.