Edit chart
Loading graph
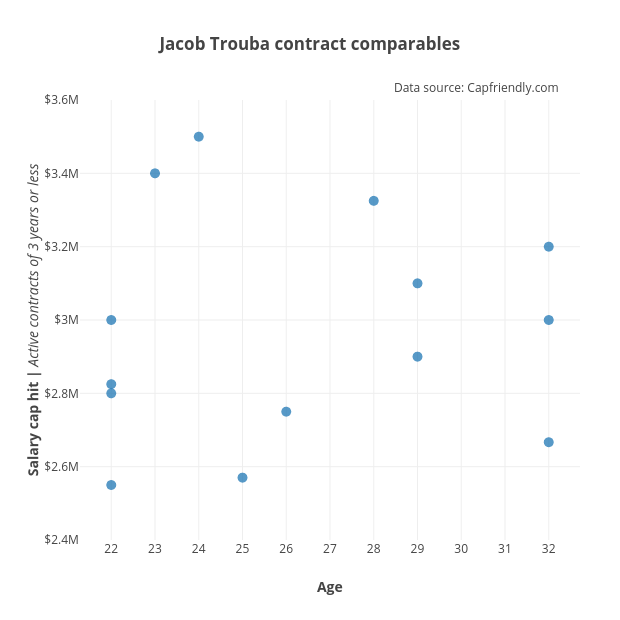
Grspur's interactive graph and data of "Jacob Trouba contract comparables" is a scatter chart, showing D; with Age in the x-axis and Salary cap hit | Active contracts of 3 years or less in the y-axis.. The x-axis shows values from 21.285714285714285 to 32.714285714285715. The y-axis shows values from 2400000 to 3600000. This visualization has the following annotation: Data source: Capfriendly.com