Edit chart
Loading graph
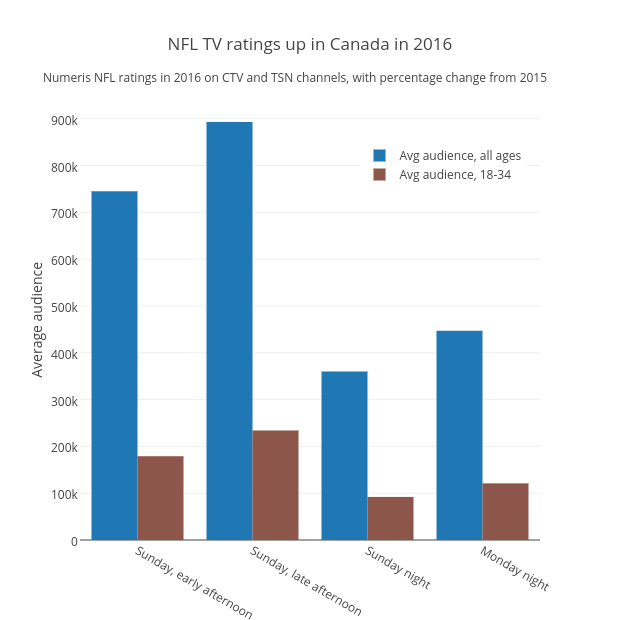
Grspur's interactive graph and data of "NFL TV ratings up in Canada in 2016" is a bar chart, showing Avg audience, all ages vs Avg audience, 18-34; with Average audience in the y-axis. The x-axis shows values from -0.5 to 3.5. The y-axis shows values from 0 to 940000. This visualization has the following annotation: Numeris NFL ratings in 2016 on CTV and TSN channels, with percentage change from 2015