Edit chart
Loading graph
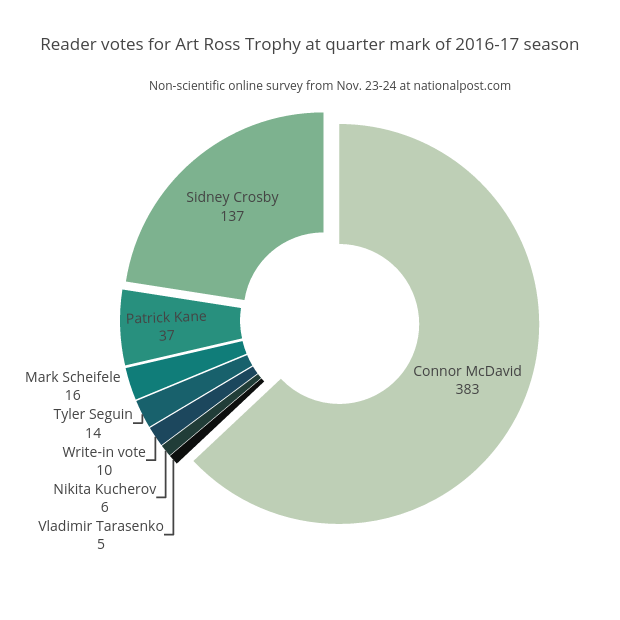
Grspur's interactive graph and data of "Reader votes for Art Ross Trophy at quarter mark of 2016-17 season" is a pie, showing Votes. The x-axis shows values from 0 to 0. The y-axis shows values from 0 to 0. This visualization has the following annotation: Non-scientific online survey from Nov. 23-24 at nationalpost.com