Edit chart
Loading graph
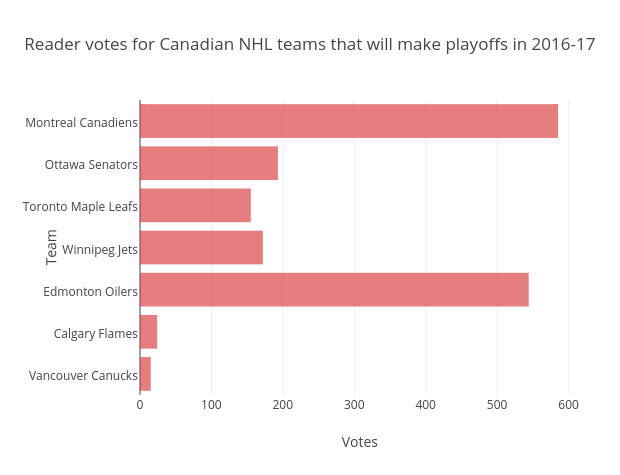
Grspur's interactive graph and data of "Reader votes for Canadian NHL teams that will make playoffs in 2016-17" is a bar chart, showing Team; with Votes in the x-axis and Team in the y-axis.. The x-axis shows values from 0 to 615.7894736842105. The y-axis shows values from -0.5 to 6.5.