Edit chart
Loading graph
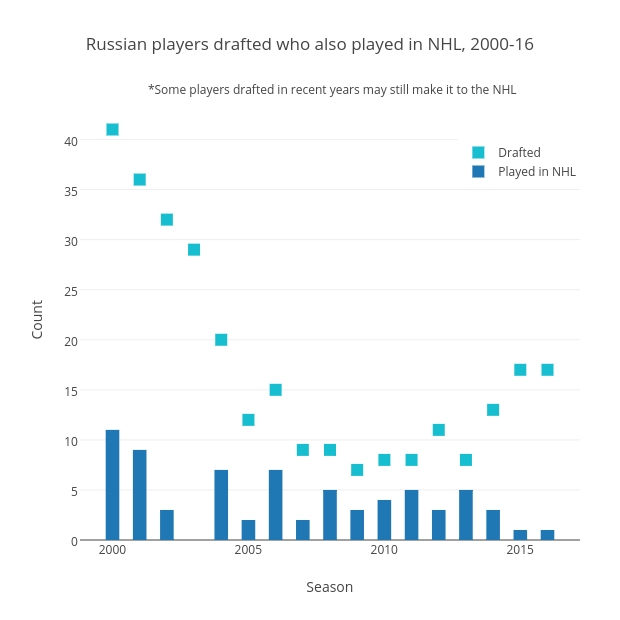
Grspur's interactive graph and data of "Russian players drafted who also played in NHL, 2000-16" is a scatter chart, showing Drafted vs Played in NHL; with Season in the x-axis and Count in the y-axis.. The x-axis shows values from 1998.8045977011495 to 2017.1954022988505. The y-axis shows values from 0 to 43.94640682095006. This visualization has the following annotation: *Some players drafted in recent years may still make it to the NHL