Edit chart
Loading graph
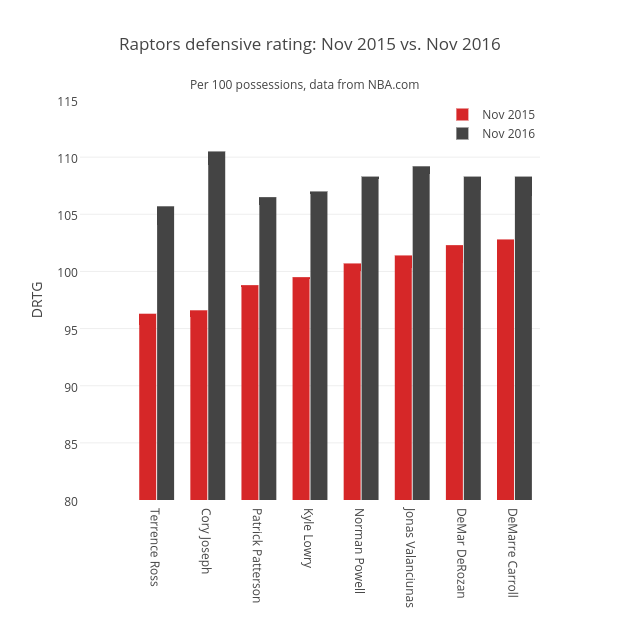
Grspur's interactive graph and data of "Raptors defensive rating: Nov 2015 vs. Nov 2016" is a bar chart, showing Nov 2015 vs Nov 2016; with DRTG in the y-axis. The x-axis shows values from -0.5 to 8.5. The y-axis shows values from 80 to 115. This visualization has the following annotation: Per 100 possessions, data from NBA.com