Edit chart
Loading graph
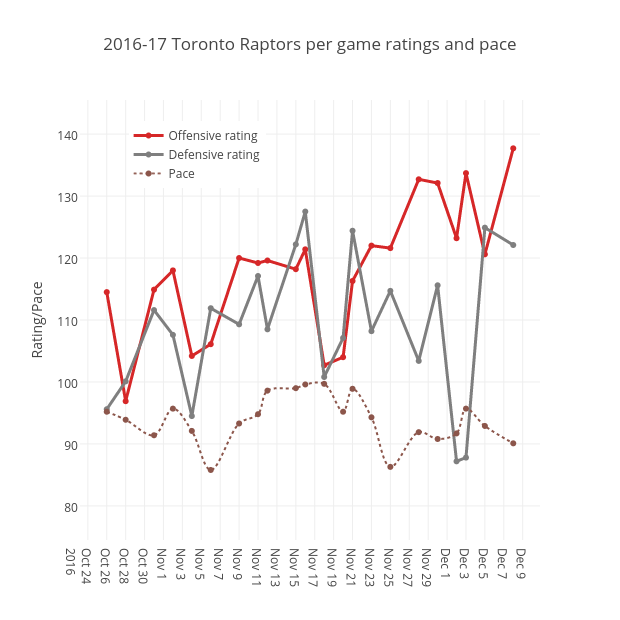
Grspur's interactive graph and data of "2016-17 Toronto Raptors per game ratings and pace" is a line chart, showing Offensive rating, Defensive rating, Pace; with Rating/Pace in the y-axis. The x-axis shows values from 2016-10-23 04:01:21.9188 to 2016-12-10 19:58:38.0812. The y-axis shows values from 74.5 to 145.5.