Edit chart
Loading graph
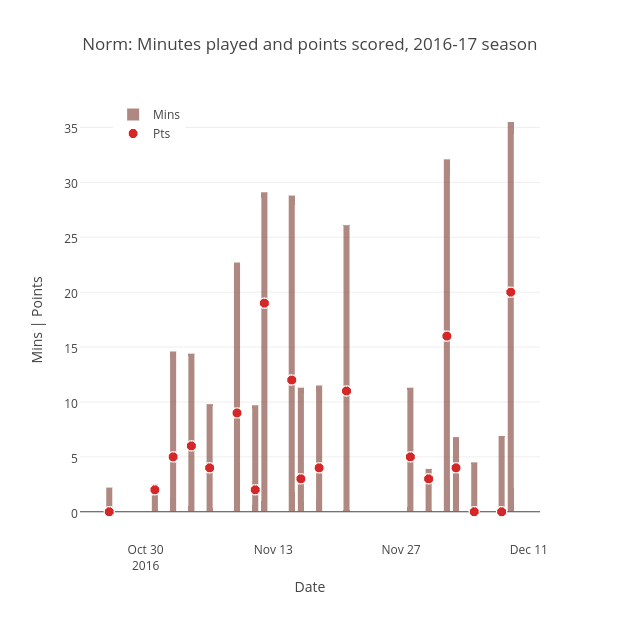
Grspur's interactive graph and data of "Norm: Minutes played and points scored, 2016-17 season" is a bar chart, showing Mins vs Pts; with Date in the x-axis and Mins | Points in the y-axis.. The x-axis shows values from 2016-10-22 18:59:44.3088 to 2016-12-12 05:00:15.6912. The y-axis shows values from -2.573123797305965 to 37.50384862091084.