Edit chart
Loading graph
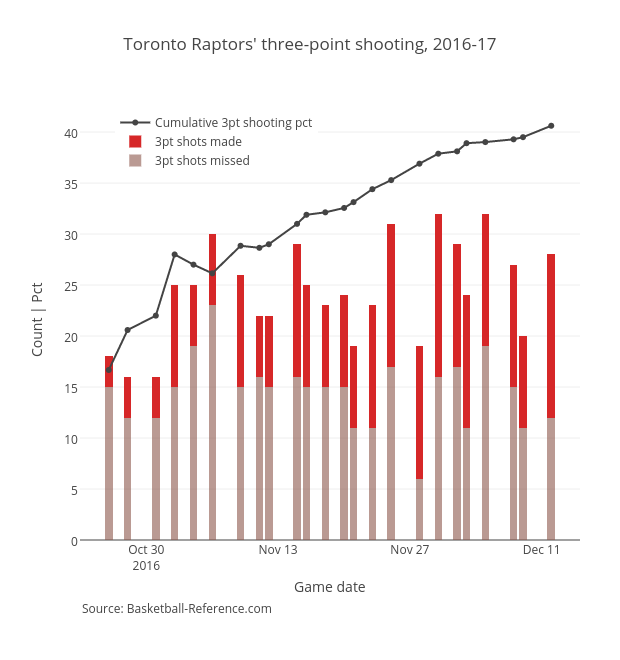
Grspur's interactive graph and data of "Toronto Raptors' three-point shooting, 2016-17" is a stacked bar chart, showing 3pt shots missed, 3pt shots made, Cumulative 3pt shooting pct; with Game date in the x-axis and Count | Pct in the y-axis.. The x-axis shows values from 2016-10-22 22:38:48.8136 to 2016-12-15 01:21:11.1864. The y-axis shows values from 0 to 43.14496077248038. This visualization has the following annotation: Source: Basketball-Reference.com