Edit chart
Loading graph
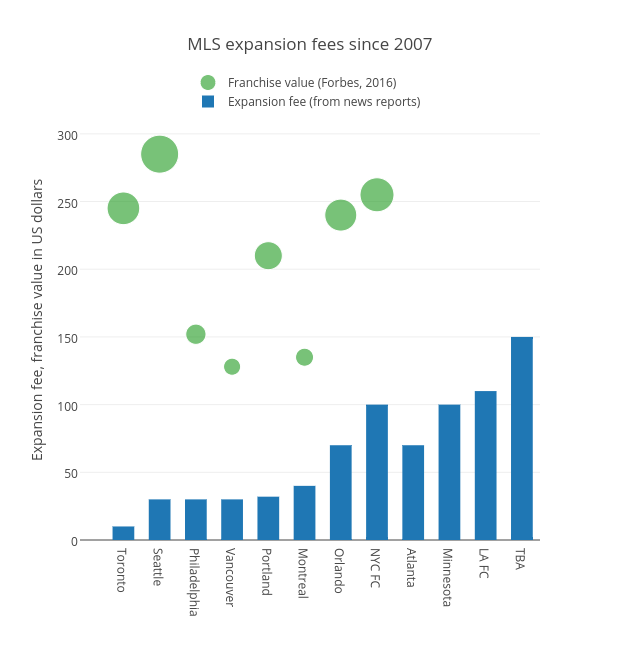
Grspur's interactive graph and data of "MLS expansion fees since 2007" is a bar chart, showing Expansion fee (from news reports) vs Franchise value (Forbes, 2016); with Expansion fee, franchise value in US dollars in the y-axis. The x-axis shows values from -1.1985397079415885 to 11.5. The y-axis shows values from 0 to 325.