Edit chart
Loading graph
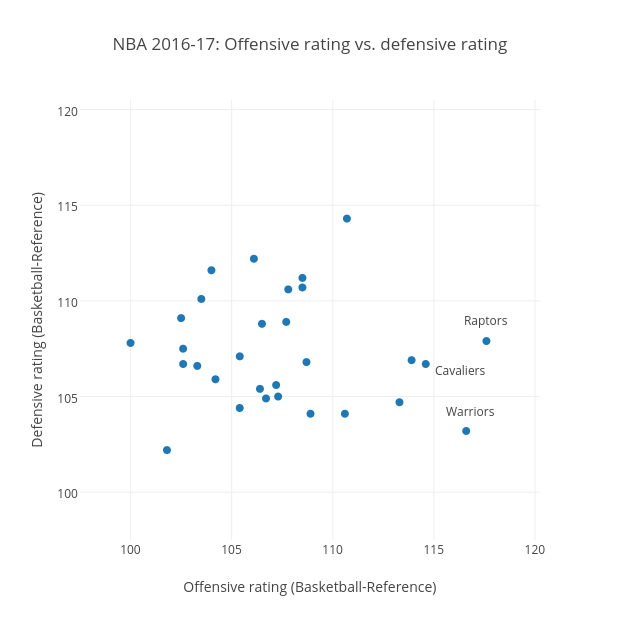
Grspur's interactive graph and data of "NBA 2016-17: Offensive rating vs. defensive rating" is a scatter chart, showing DRtg; with Offensive rating (Basketball-Reference) in the x-axis and Defensive rating (Basketball-Reference) in the y-axis.. The x-axis shows values from 97.5 to 120.25. The y-axis shows values from 97.5 to 120.5. This visualization has the following annotations: Raptors; Warriors; Cavaliers