Edit chart
Loading graph
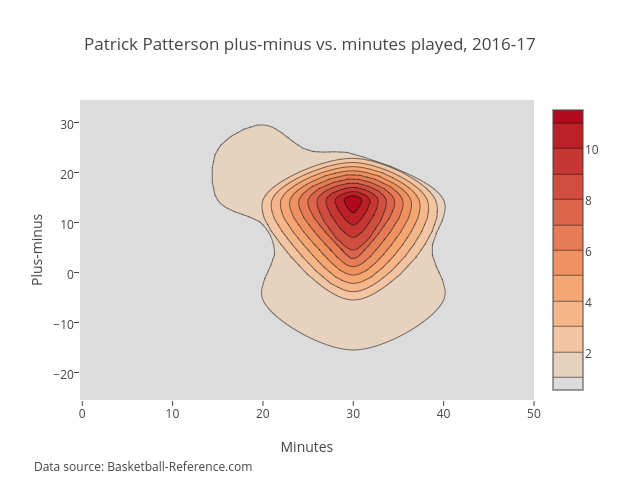
Grspur's interactive graph and data of "Patrick Patterson plus-minus vs. minutes played, 2016-17" is a histogram2dcontour, showing Plus-minus; with Minutes in the x-axis and Plus-minus in the y-axis.. The x-axis shows values from -0.25 to 50. The y-axis shows values from -25.5 to 34.5. This visualization has the following annotation: Data source: Basketball-Reference.com