Edit chart
Loading graph
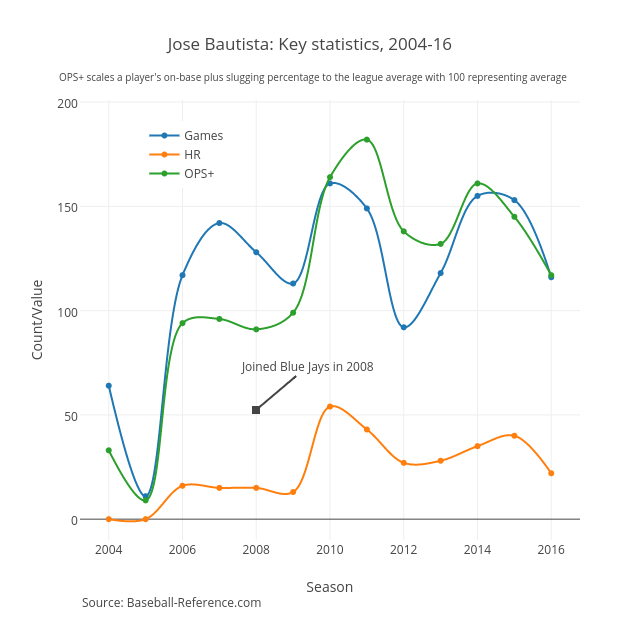
Grspur's interactive graph and data of "Jose Bautista: Key statistics, 2004-16" is a line chart, showing Games, HR, OPS+; with Season in the x-axis and Count/Value in the y-axis.. The x-axis shows values from 2003.2203389830509 to 2016.7796610169491. The y-axis shows values from -10 to 201. This visualization has the following annotations: Source: Baseball-Reference.com; Joined Blue Jays in 2008; OPS+ scales a player's on-base plus slugging percentage to the league average with 100 representing average