Edit chart
Loading graph
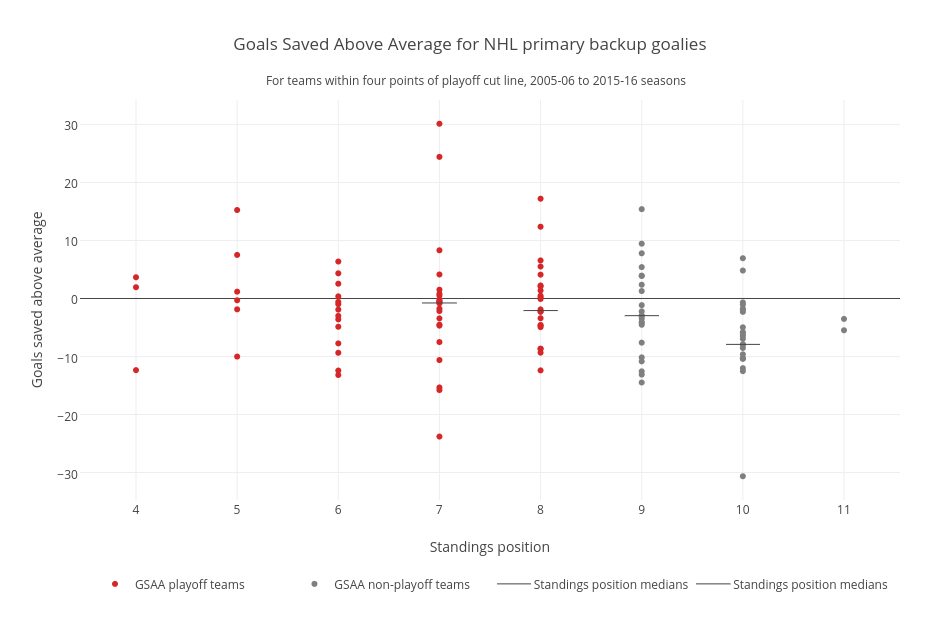
Grspur's interactive graph and data of "Goals Saved Above Average for NHL primary backup goalies" is a scatter chart, showing GSAA playoff teams, GSAA non-playoff teams, Standings position medians, Standings position medians; with Standings position in the x-axis and Goals saved above average in the y-axis.. The x-axis shows values from 3.446327683615819 to 11.55367231638418. The y-axis shows values from -34.73375886524823 to 34.21375886524823. This visualization has the following annotation: For teams within four points of playoff cut line, 2005-06 to 2015-16 seasons