Edit chart
Loading graph
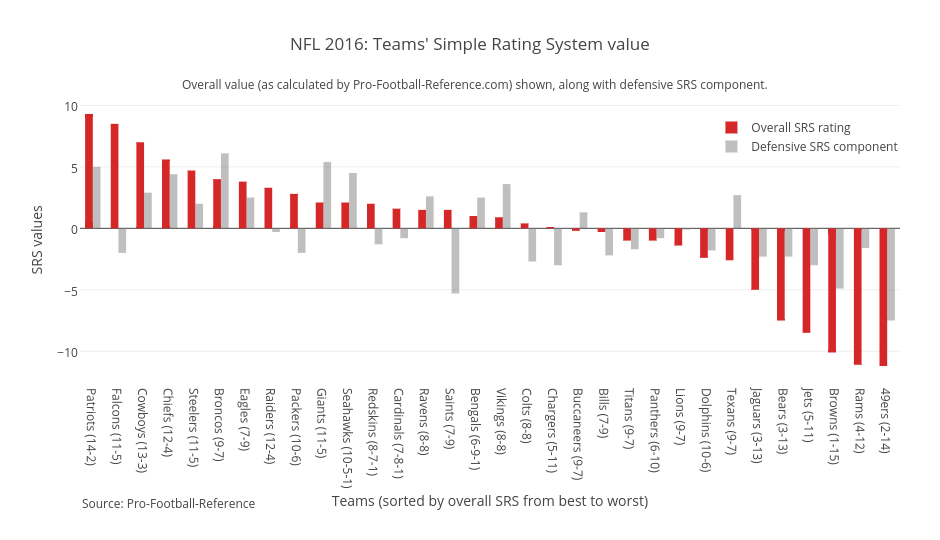
Grspur's interactive graph and data of "NFL 2016: Teams' Simple Rating System value" is a grouped bar chart, showing Overall SRS rating vs Defensive SRS component; with Teams (sorted by overall SRS from best to worst) in the x-axis and SRS values in the y-axis.. The x-axis shows values from -0.5 to 31.5. The y-axis shows values from -12.338888888888889 to 10.43888888888889. This visualization has the following annotations: Overall value (as calculated by Pro-Football-Reference.com) shown, along with defensive SRS component.; Source: Pro-Football-Reference