Edit chart
Loading graph
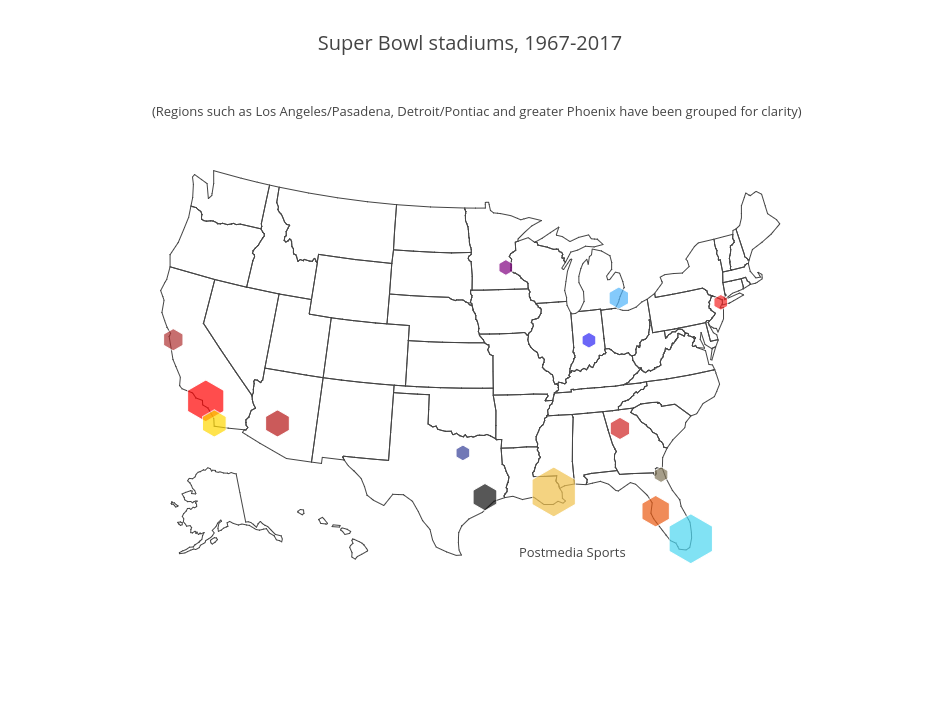
Grspur's interactive graph and data of "Super Bowl stadiums, 1967-2017" is a scattergeo, showing E. The x-axis shows values from 0 to 0. The y-axis shows values from 0 to 0. This visualization has the following annotations: (Regions such as Los Angeles/Pasadena, Detroit/Pontiac and greater Phoenix have been grouped for clarity); Postmedia Sports