Edit chart
Loading graph
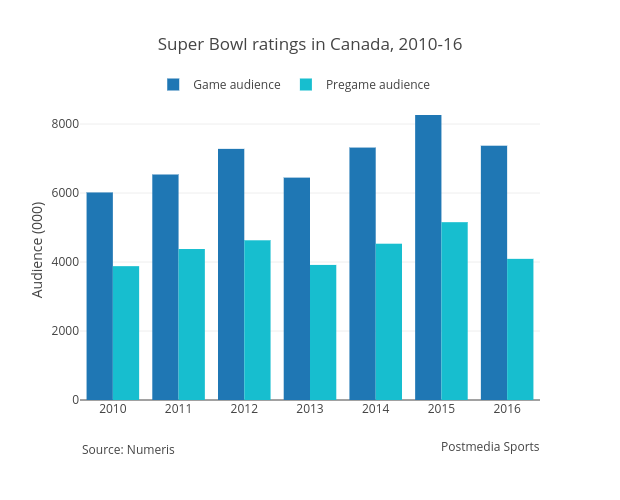
Grspur's interactive graph and data of "Super Bowl ratings in Canada, 2010-16" is a bar chart, showing Game audience vs Pregame audience; with Audience (000) in the y-axis. The x-axis shows values from 2009.5 to 2016.5. The y-axis shows values from 0 to 8696.842105263158. This visualization has the following annotations: Source: Numeris; Postmedia Sports