Edit chart
Loading graph
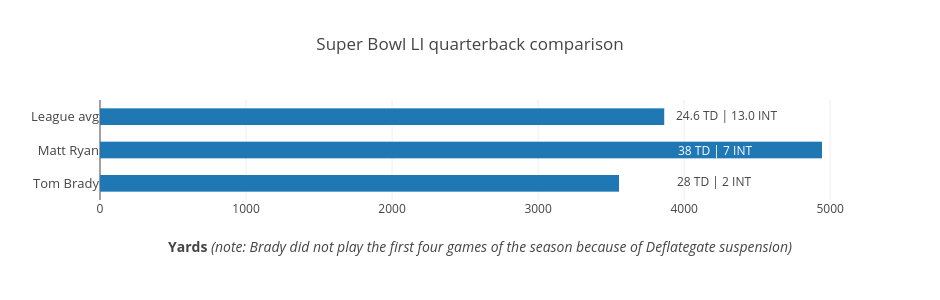
Grspur's interactive graph and data of "Super Bowl LI quarterback comparison" is a bar chart, showing Col2; with Yards (note: Brady did not play the first four games of the season because of Deflategate suspension) in the x-axis. The x-axis shows values from 0 to 5204.210526315789. The y-axis shows values from -0.5 to 2.5. This visualization has the following annotations: 24.6 TD | 13.0 INT; 38 TD | 7 INT; 28 TD | 2 INT