Edit chart
Loading graph
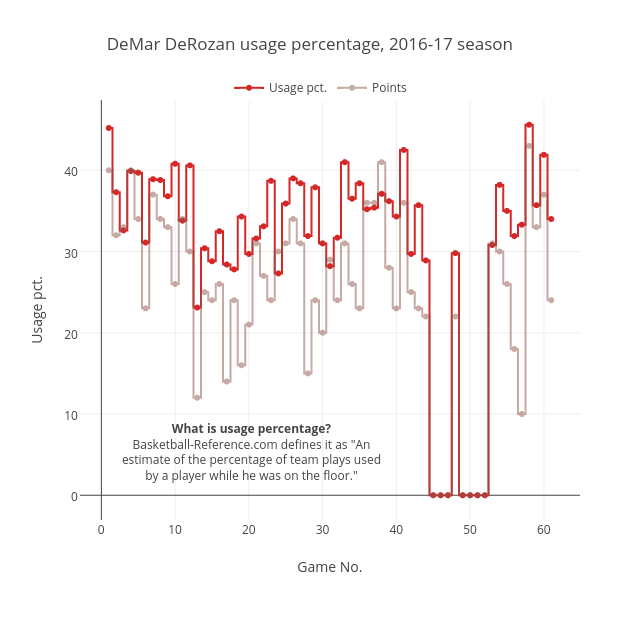
Grspur's interactive graph and data of "DeMar DeRozan usage percentage, 2016-17 season" is a line chart, showing Usage pct. vs Points; with Game No. in the x-axis and Usage pct. in the y-axis.. The x-axis shows values from -2.8983050847457625 to 64.89830508474576. The y-axis shows values from -3.0461538461538464 to 48.64615384615385. This visualization has the following annotation: What is usage percentage?Basketball-Reference.com defines it as "Anestimate of the percentage of team plays usedby a player while he was on the floor."