Edit chart
Loading graph
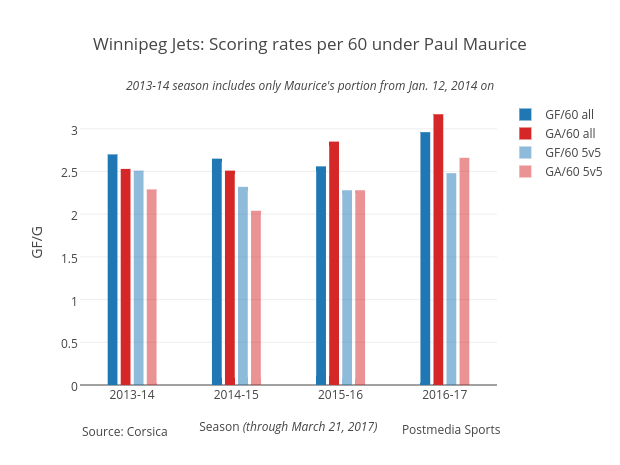
Grspur's interactive graph and data of "Winnipeg Jets: Scoring rates per 60 under Paul Maurice" is a bar chart, showing GF/60 all, GA/60 all, GF/60 5v5, GA/60 5v5; with Season (through March 21, 2017) in the x-axis and GF/G in the y-axis.. The x-axis shows values from -0.5 to 3.5. The y-axis shows values from 0 to 3.336842105263158. This visualization has the following annotations: Source: Corsica; Postmedia Sports; 2013-14 season includes only Maurice's portion from Jan. 12, 2014 on